RiceRegMap Tutorial
Tutorial Navigation:
· 1. How to search for Cis-Regulatory Region by gene?
· 2. How to search for Upstream Regulator?
· 3. How to search for Downstream Target by gene?
· 4. How to search for functional variations impacting gene/bin?
· 5. How to colocalize various GWAS variations?
· 6. How to enrich Upstream Regulator by specify regions?
· 7. How to search for Omic Profile by gene?
· 8. How to search for Phenotype related information?
· 9. How to search for motif information by gene/bin?
RiceRegMap is a database that contains population based 275
RNA-seq data and 219 ATAC-seq data of rice 1-2mm young panicle.

RiceRegMap enables online access to gene regulation and variation data, supporting the clarification of rice gene functions and mechanisms. (e.g., 'Find Cis-Regulatory Region', 'Find Upstream Regulator' and 'Search For Expression/Accessibility-GWAS' ) and many useful analysis tools (e.g., 'eCAAS Enrichment', 'Coloclization'). It supports online queries for gene cis-regulatory regions, expression regulatory relationships, and key functional variations. You can visit this version of RiceRegMap by entering its address http://riceregmap.ncpgr.cn.
1. How to search for Cis-Regulatory Region by gene? Top
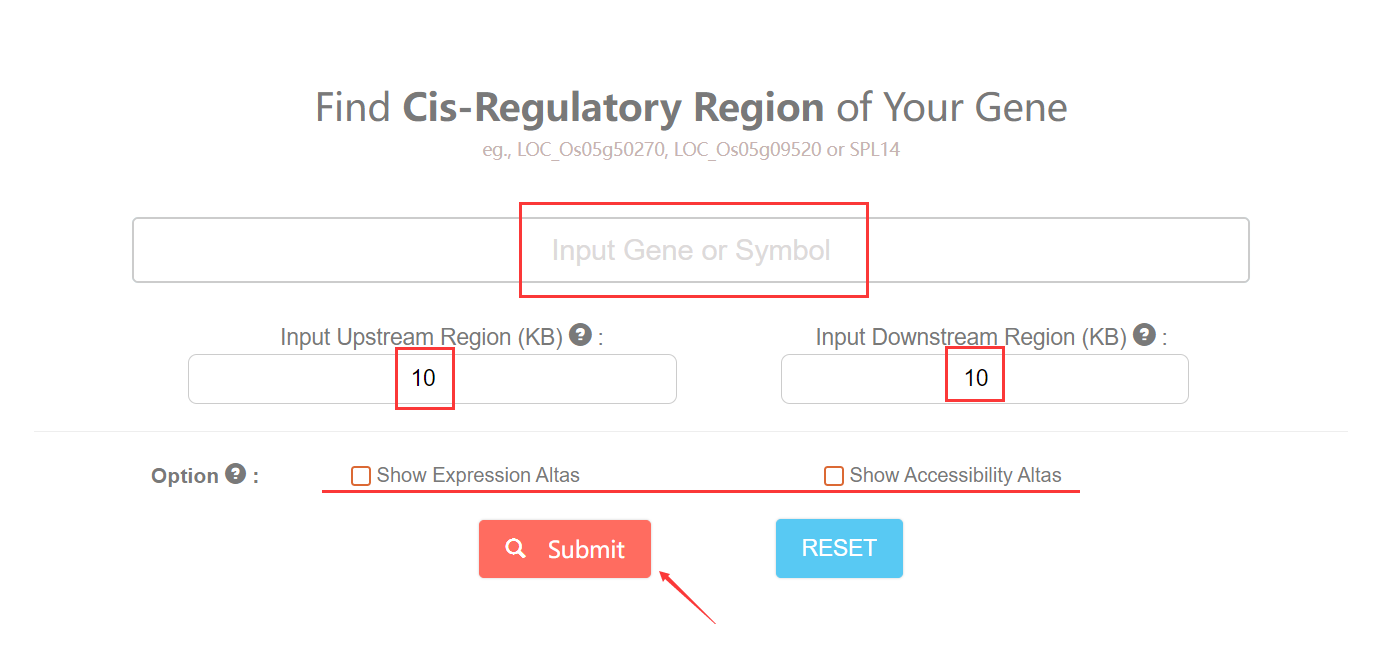
To start with, You can click this link. You need to specify one gene using ID or Symbol and define the ranges. For results display, you can check the option box for more omic information of inputed gene.
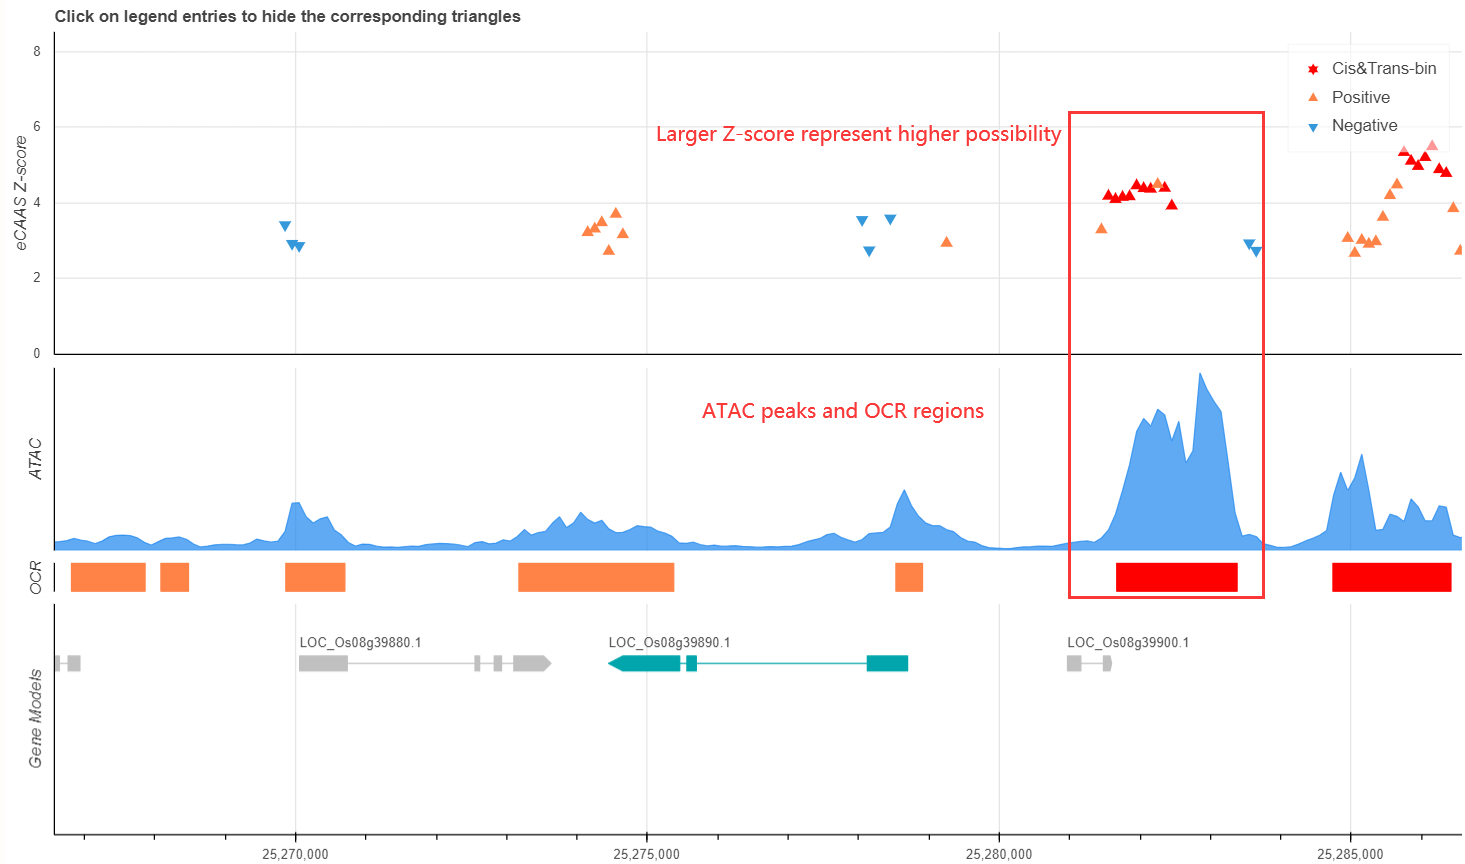
Then the cis-regulatory results for your searched gene will be returned. Local-eCAAS result imply potential Cis Regulatory OCRs of target gene. The larger the Z-score of Bin, the more possiblily that it is in a critical Cis-Regulatory Region. The cis&trans-association strategy shows below (trans-EC / Original Expression) (Ming et al., 2023).
The red triangles in Local-eCAAS plot represent the cis&trans significant bins, which are the most possible Casual-Regulation Region of target gene (with the association threshold of cis-AC P<0.01 and trans-AC FDR<0.05)
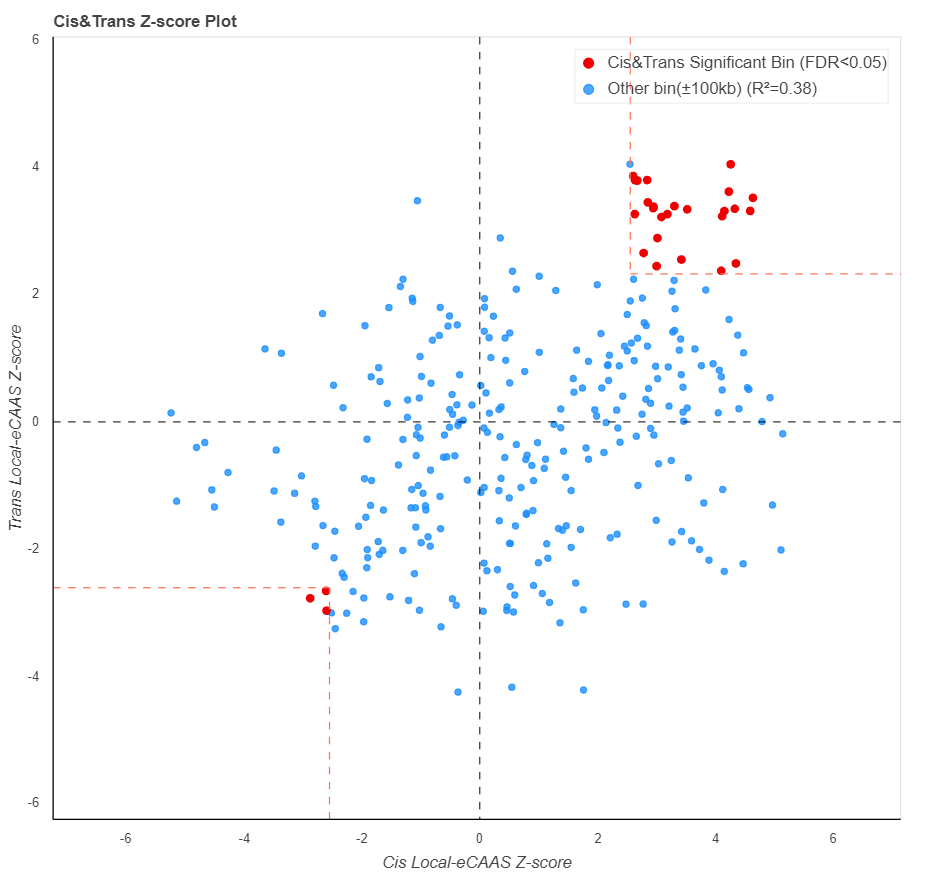
The scatter plot below represent the two stage association Z-score of both cis-AC and trans-AC to target gene expression. Red point is corresponding to Cis&Trans significant bins of plot above.
2. How to search for Upstream Regulator? Top
To start with, You can click this link. In last section, you will get the bin ID that associated with target gene expression. Here you can find the upstream regulator for target gene using the bin ID. As the step follows below.
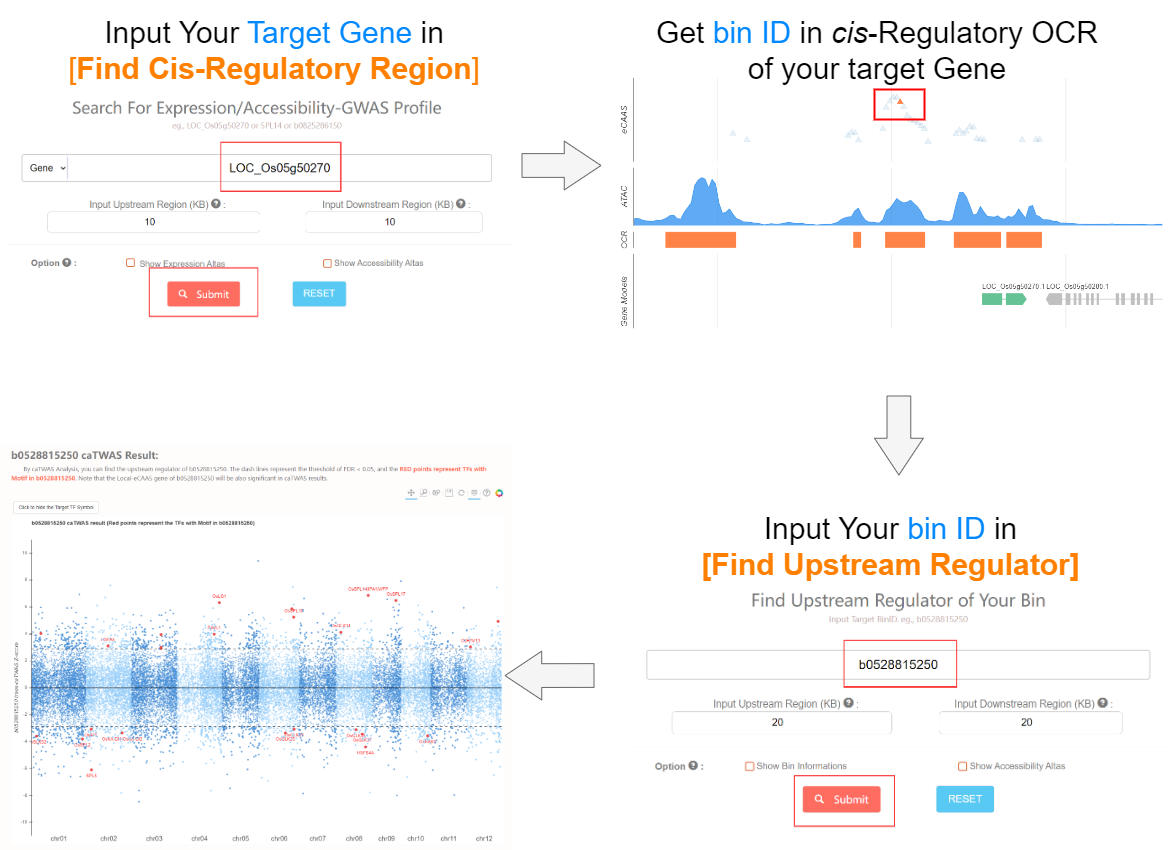
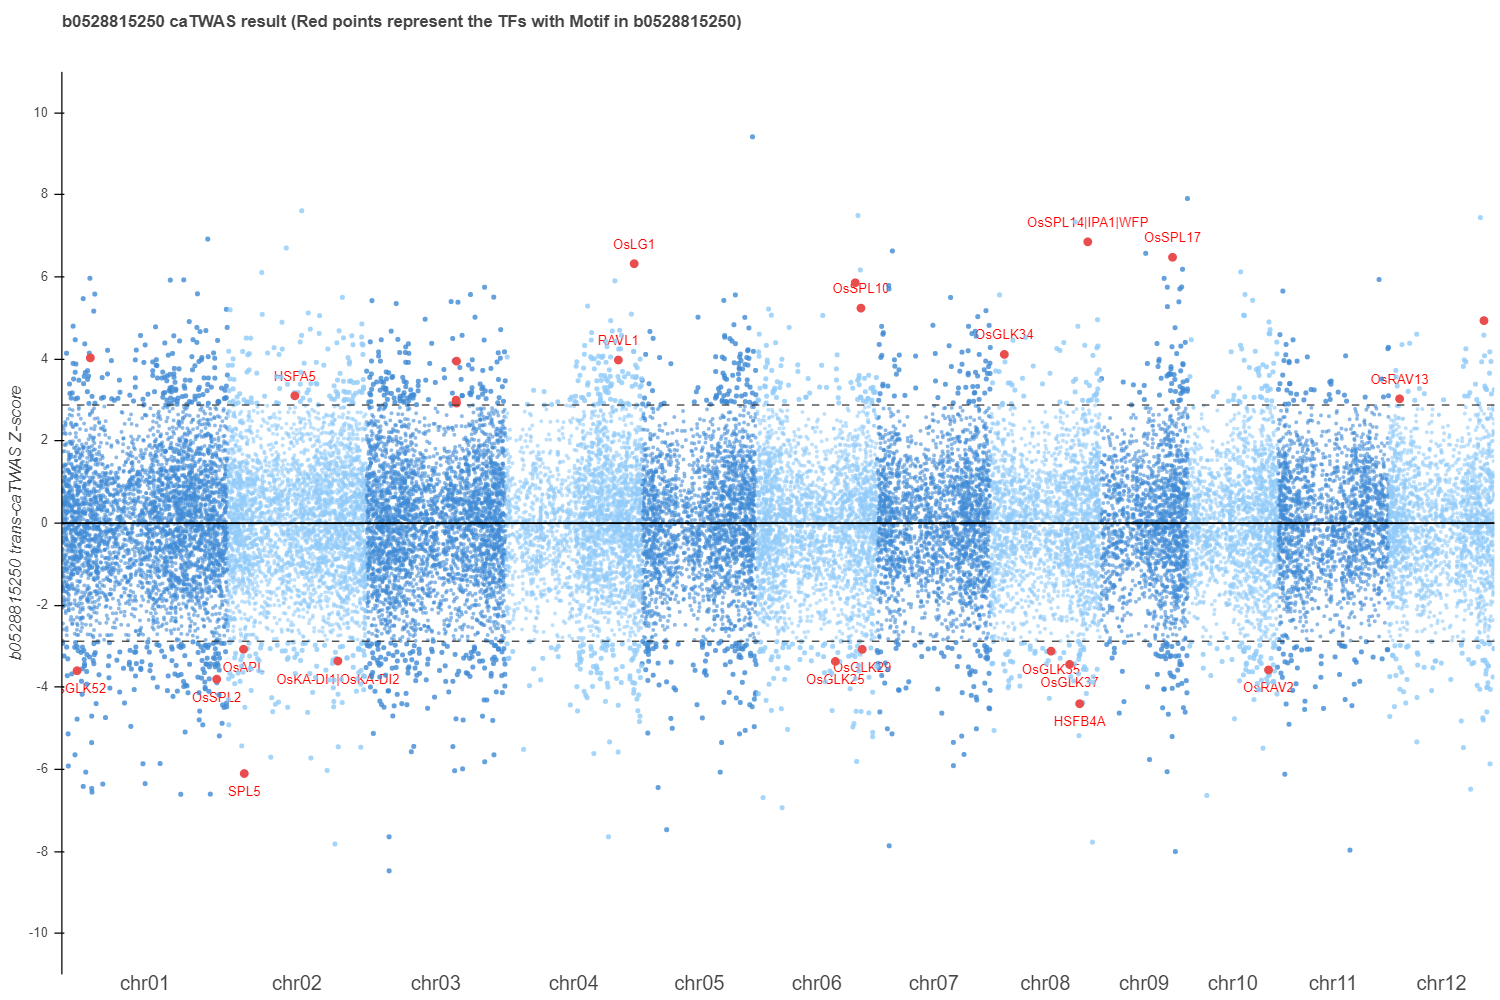
Then all associated upstreams will be returned. In caTWAS manhattan plot, the points with thresholds of FDR<0.05 (dash lines) are considered as siginificant upstream, and red points represents genes with motif in searched bin.
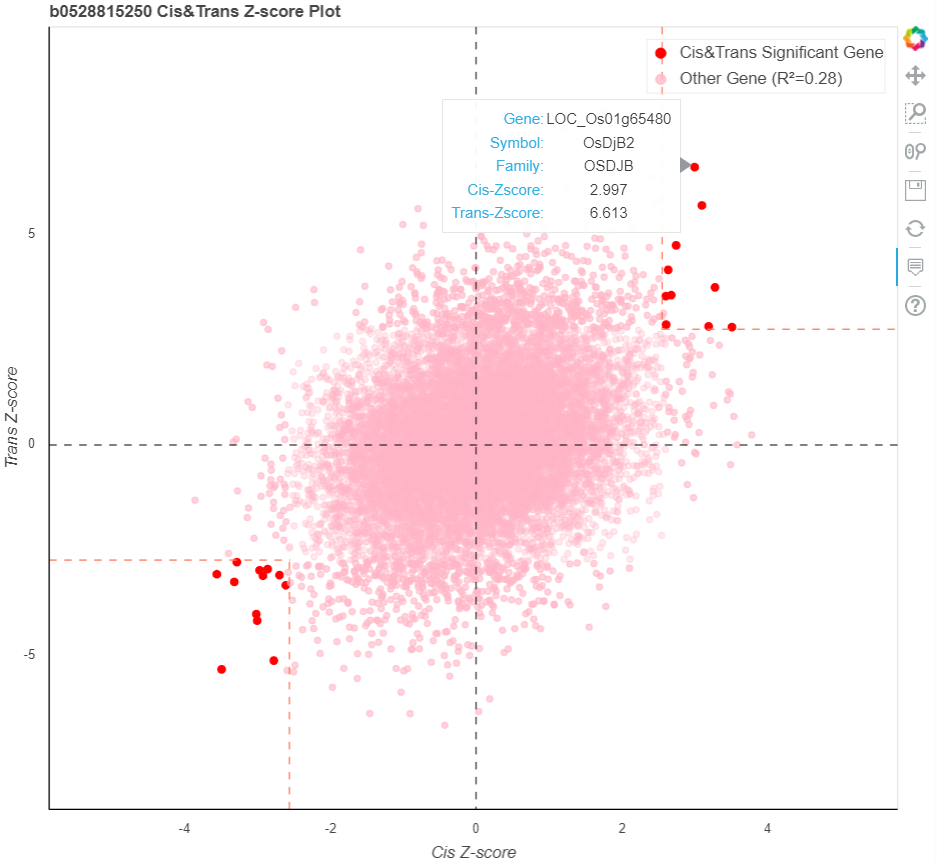
As same to the Z-score scatter plot in Quesion1, the scatter plot represent the twice associations between searched bins and upstream genes expression components (cis/trans-EC) (Ming et al., 2023). Red points represent upstream genes siginificanct in both associations.
3. How to search for Downstream Target by gene? Top
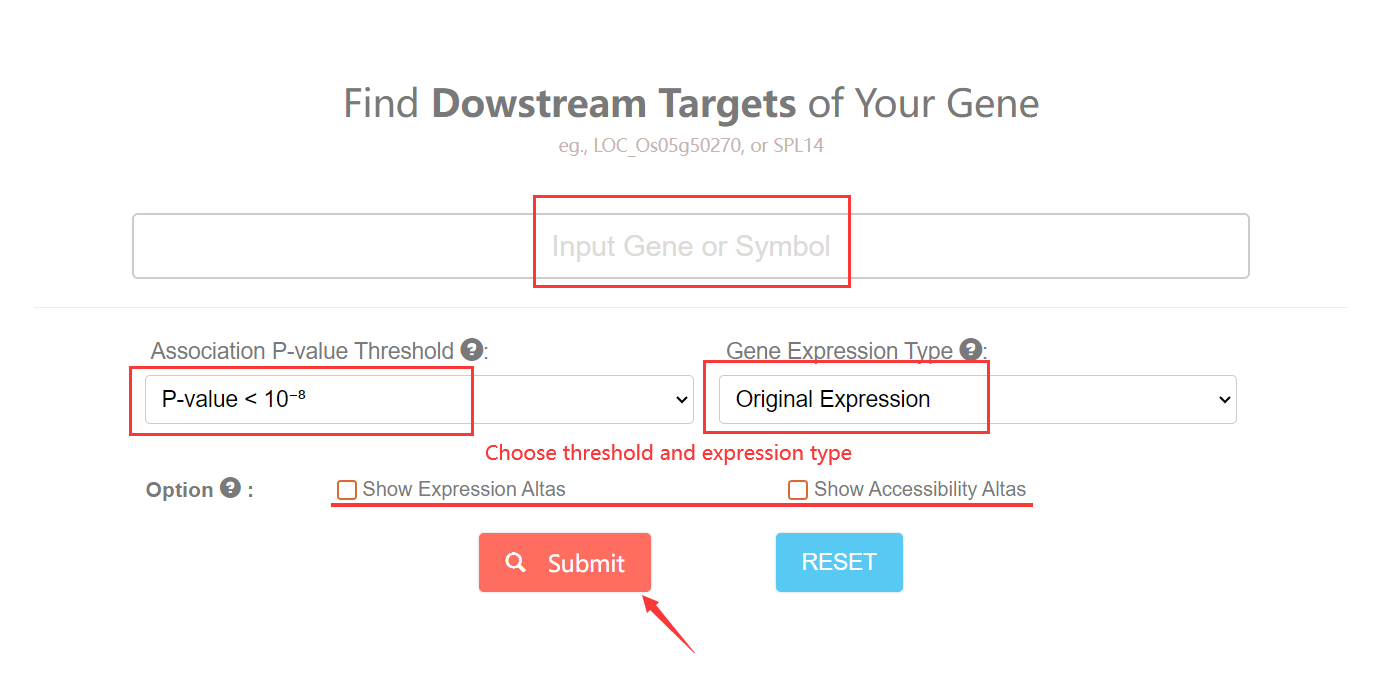
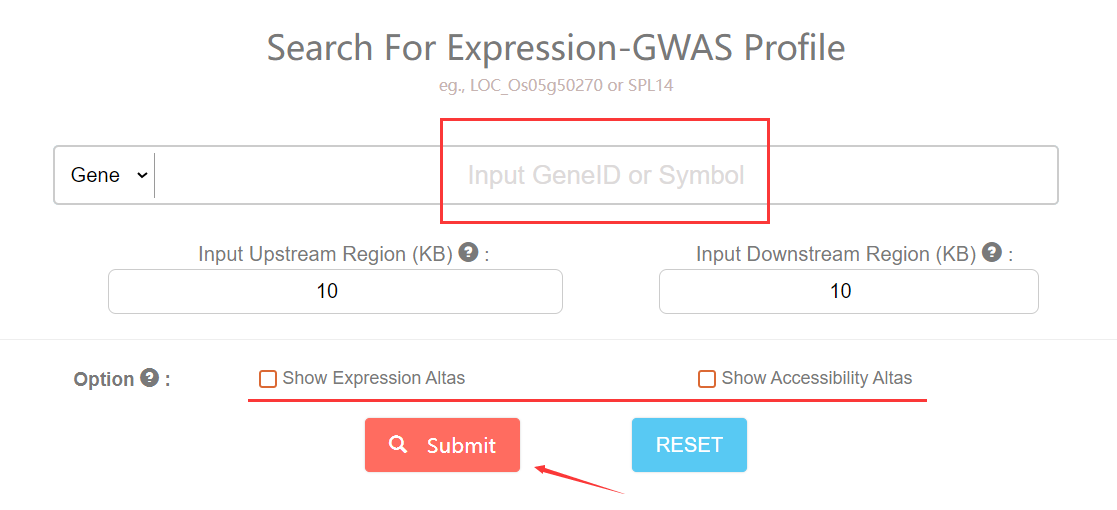
To start with, You can click this link. You need to input one gene and then specify association threshold and expression type (trans-EC / Original Expression) (Ming et al., 2023) of your searched gene. Selcet the trans-EC and more tighter threshold for gene will reduce the possible downstream and the fasle discovery. For results display, you can check the option box for more omic information of inputed gene.
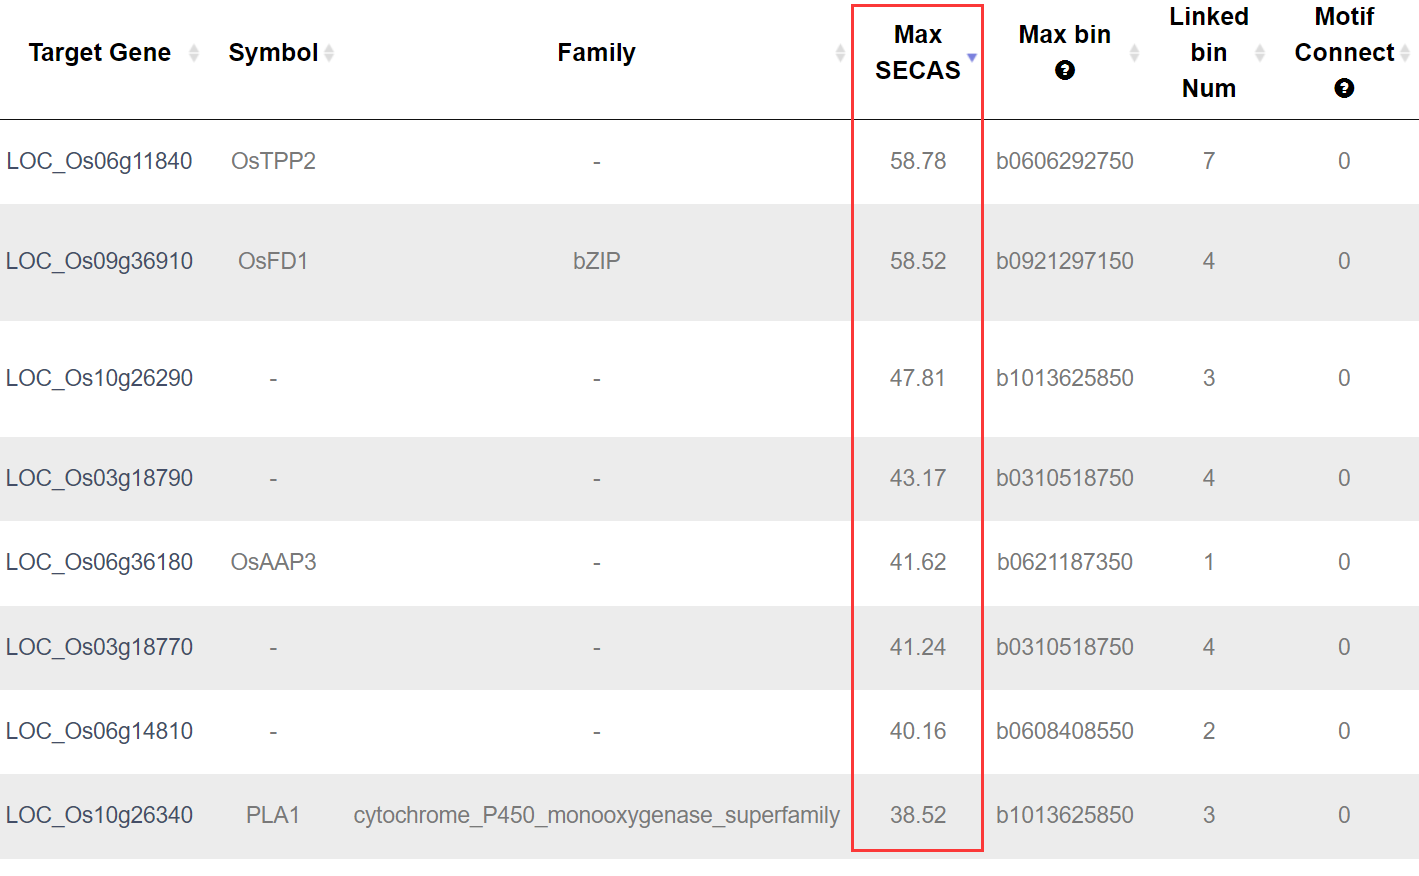
For the results retuned, all possible downstream will shows in the plot that genes expression are connected by bins accessibility. All detail annotations about the plot are illuminated in caption.
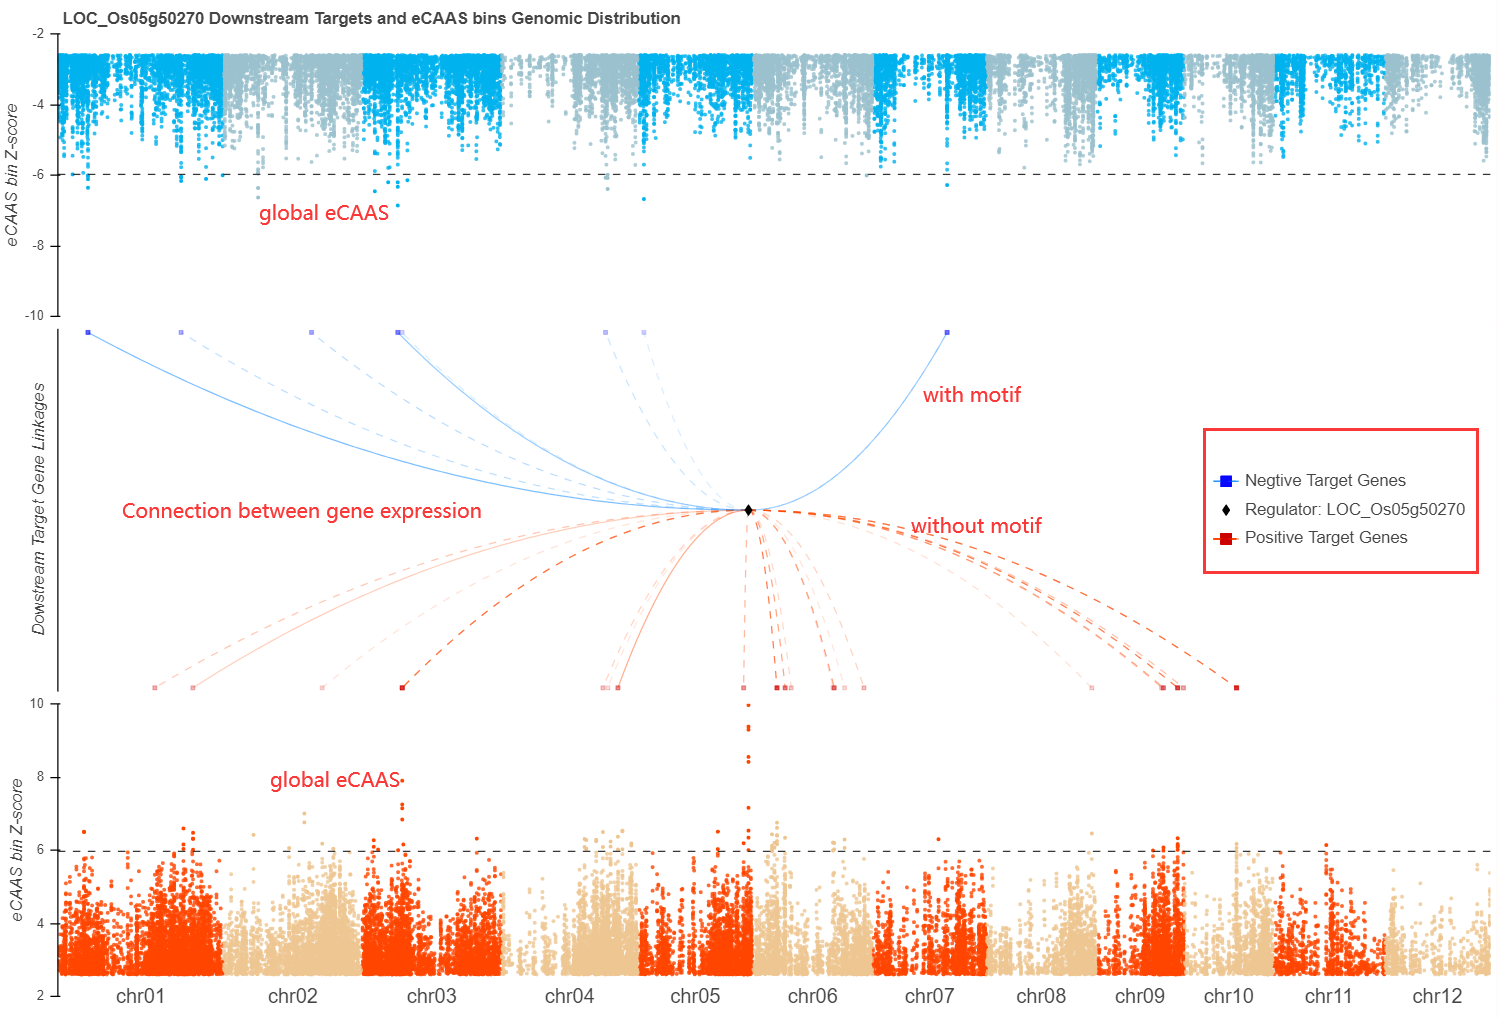
SECAS score is used to measure the possiblily of the downstreams to your searched gene. The score is based on multiple data, including the degree of association, co-expression, bins accessibility and their distance to target gene transcription start site (TSS).
4. How to search for functional variations impacting gene/bin? Top
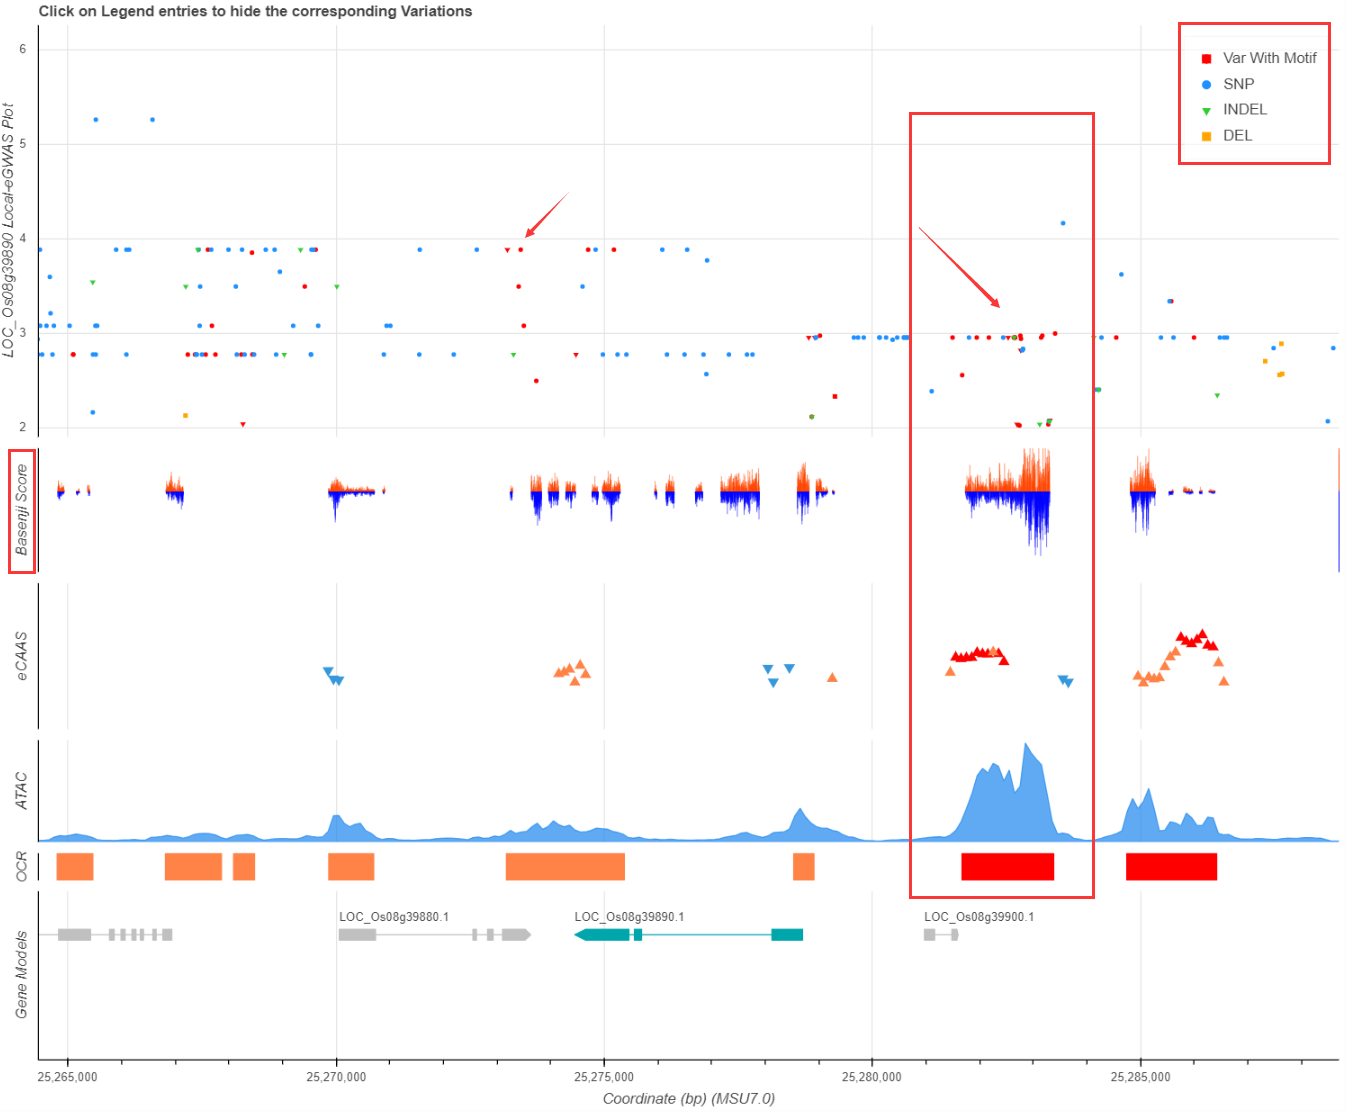
To start with, You can click this link for gene or this link for bin ID. You need to input one gene or bin ID. You should also define the plot ranges of seached gene/bin (options). All variations associated with gene/bin will be retuned.
Different variations (SNP/INDEL/DEL) are marked with different colors and shapes, and red points represent known TF motif changes. Basenji score are the variation effect to chromatin accessibility (Zhao et al., 2021). Local-eCAAS and ATAC peaks are also showed in the plot below. You should pay close attention to variations that alter transcription factor (TF) motifs, show strong association with queried gene/bin, have high Basenji effect score, and locate in OCR regions. All these informations will help to find key variations.
5. How to colocalize various GWAS variations? Top
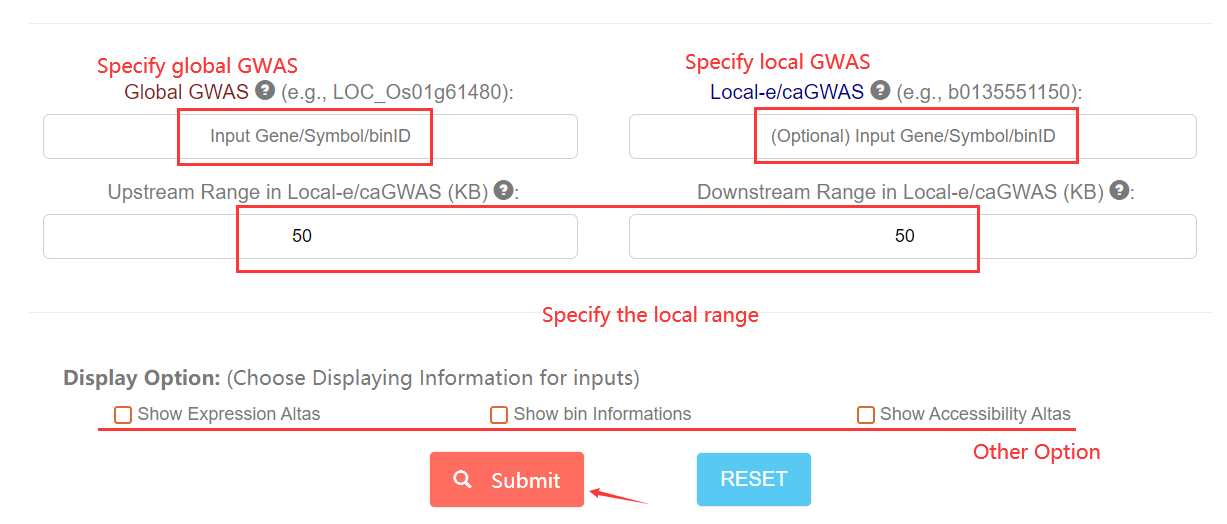
To start with, You can click this link for Expression/Accessibility colocalization, or click this link to upload a file to colocalize with our Expression/Accessibility-GWAS result. In this section, you firstly need specify one Global-GWAS result by inputing the gene/bin ID or uploading the GWAS file. Note that if you uploaded file should contains 2 columns:'SNP' and 'P'. And then you should specify the Local-GWAS result by inputing the gene/bin ID. Finally, you should configure the range of Local-GWAS regions, where the colocalization will be conducted in. Then the colocalization profile will be returned in few minutes.
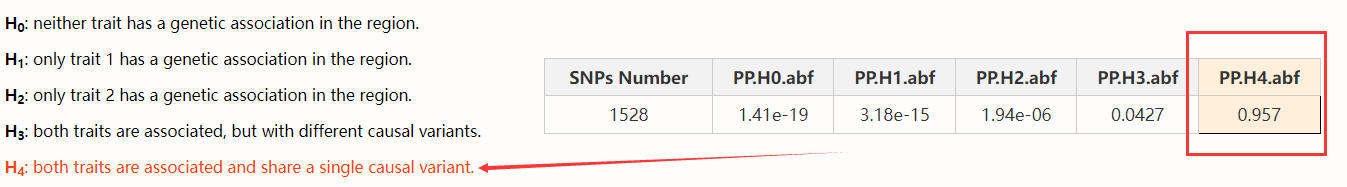
Before check out the colocalization results, you need to inspect the profile table. The results are valid when the Bayesian posterior probability for H4 (PPH4) > 0.5, and at least one variation shared by two GWAS association.
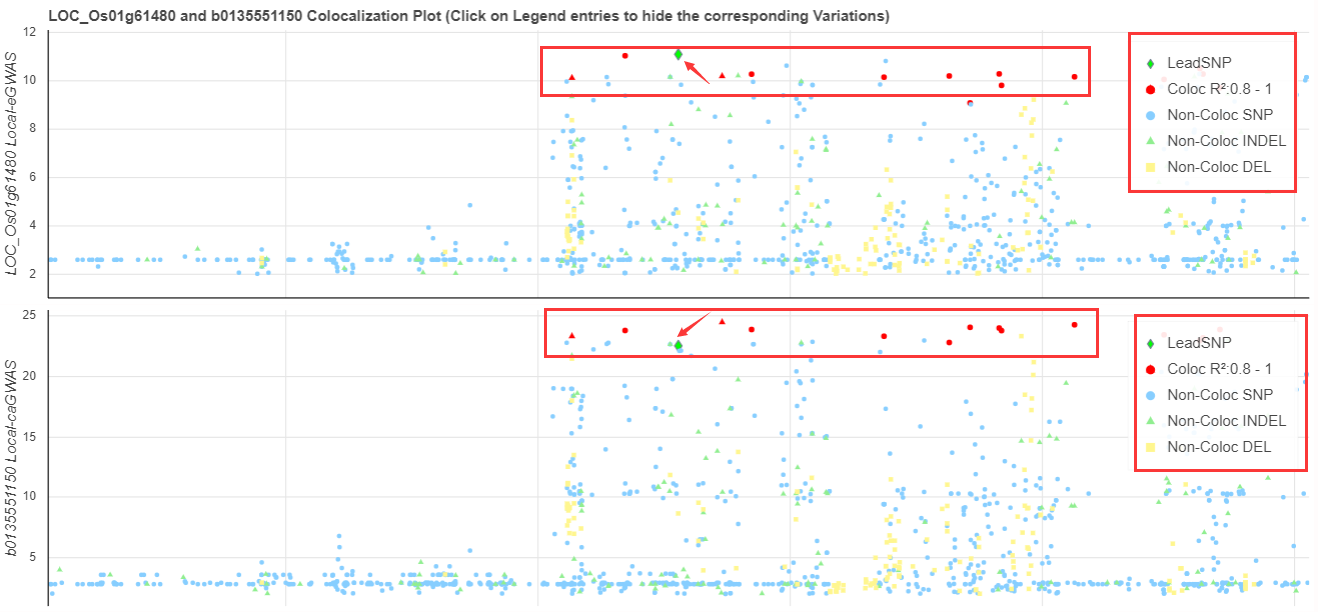
The coloc plot is similar to QUESTION 4, while the red points are the colocalized variations. The LD information between global-GWAS leadSNP (in defined region) and colocalized variations will also demonstrate.
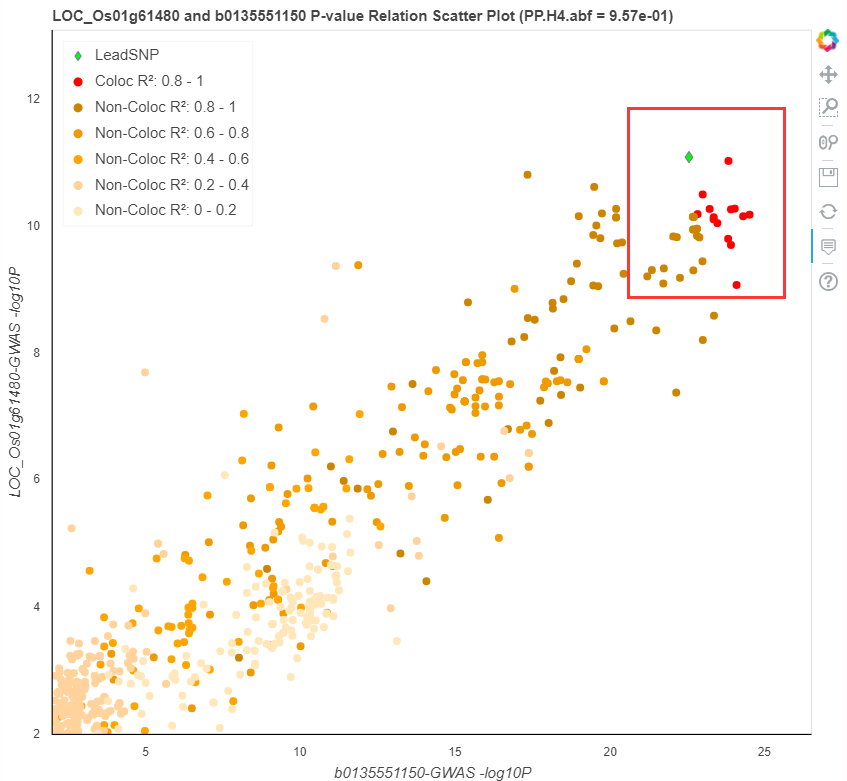
The scatter plot below shows corelations between shared variations, the LD informations are also availible.
6. How to enrich Upstream Regulator by specify regions? Top
To start with, You can click this link. You need to upload a BED file to specify your functional regions. And then choose threshold and upstream expression type (trans-EC or original expression) (Ming et al., 2023) to submit your request. The eCAAS enrichment result will be retuned as CSV format in few minutes.
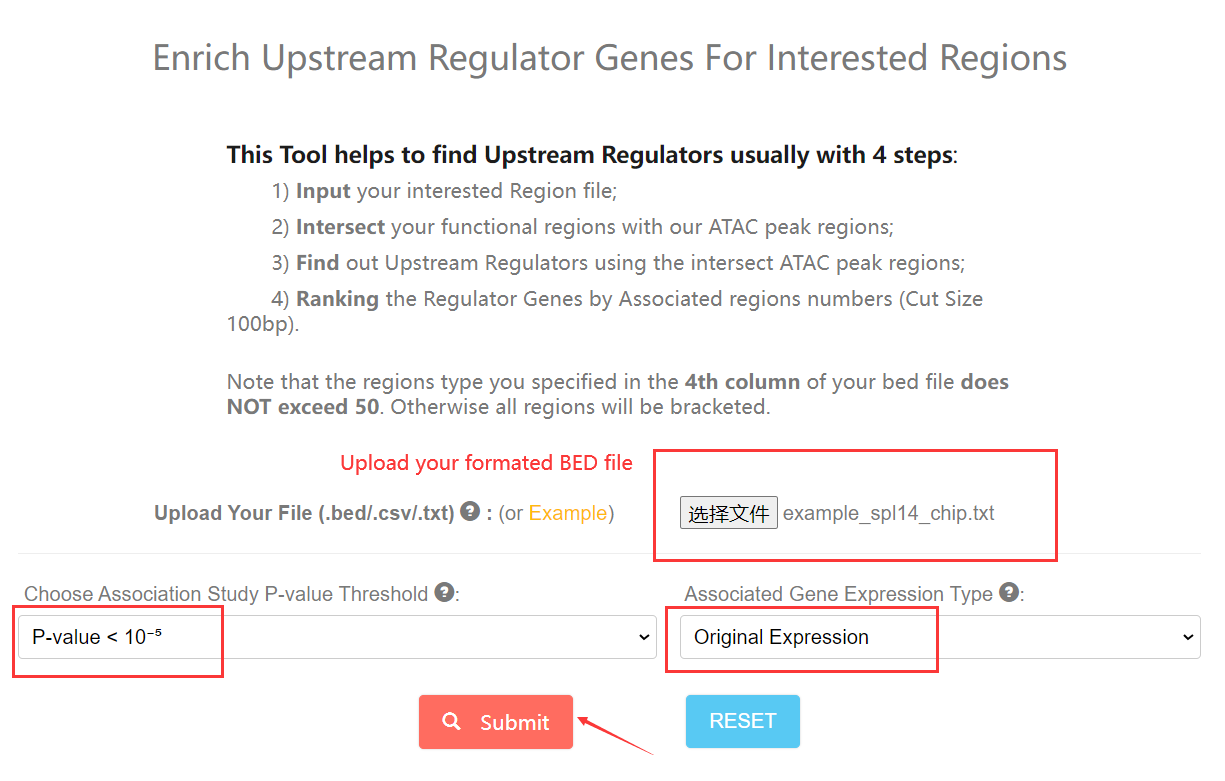
You can specify multipule regions type in 4th column of your file, but the regions type number (not region number) does NOT exceed 50. Otherwise all regions will be bracketed.
The ranking in returned CSV is based by all bin number (sum of all regions) that upstream gene associated with. Each region type you specifed will be also included, you can ranking by every region types freely.
7. How to search for Omic Profile by gene? Top
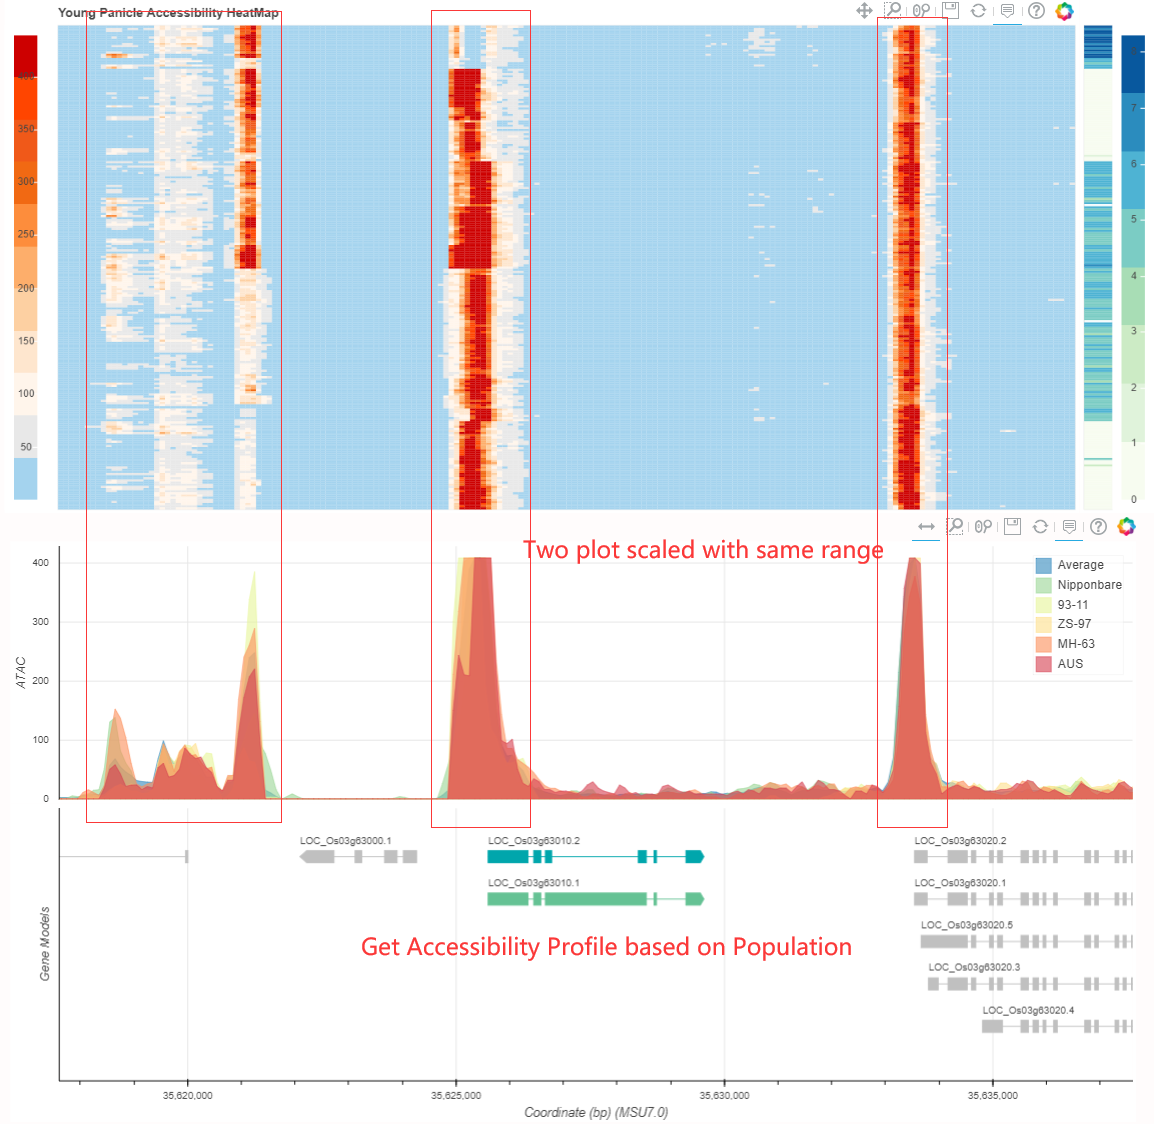
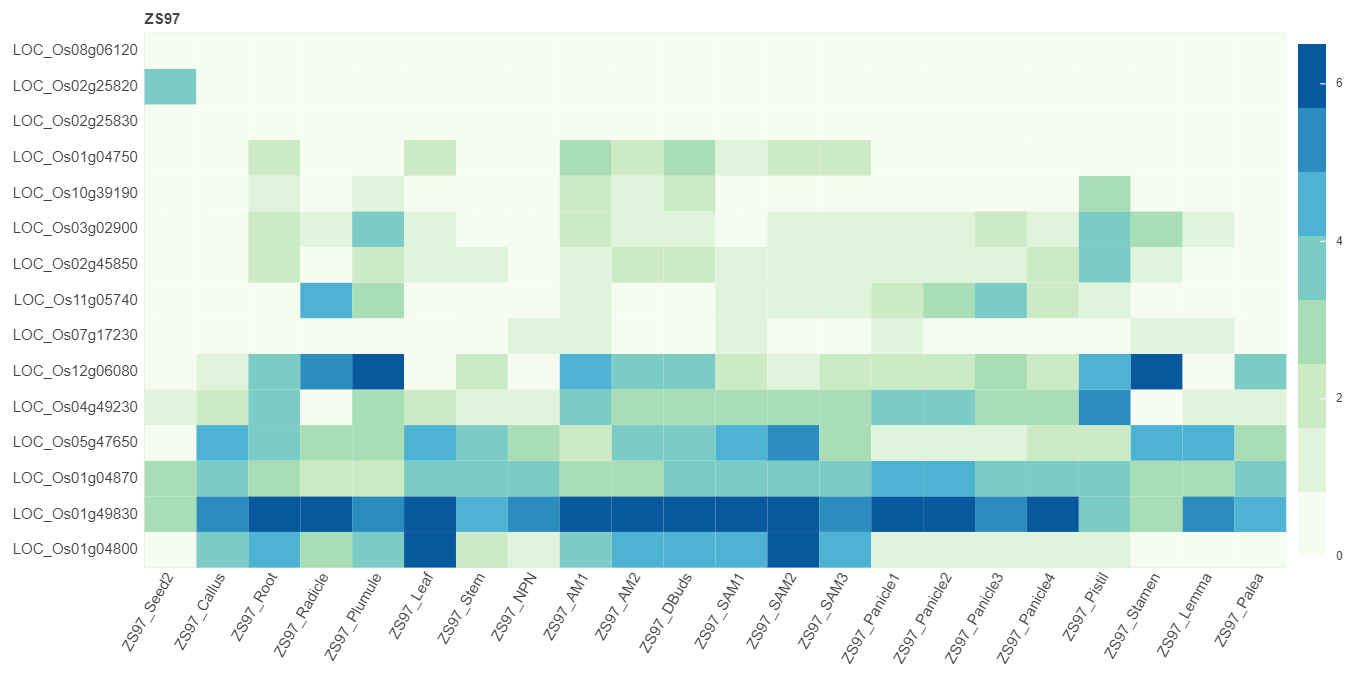
To start with, You can click this link. Just input your keyword including but not limited to geneID symbol or binID, relative omic profile will be ruturned. Omic profile results contain expression and accessibility maps.
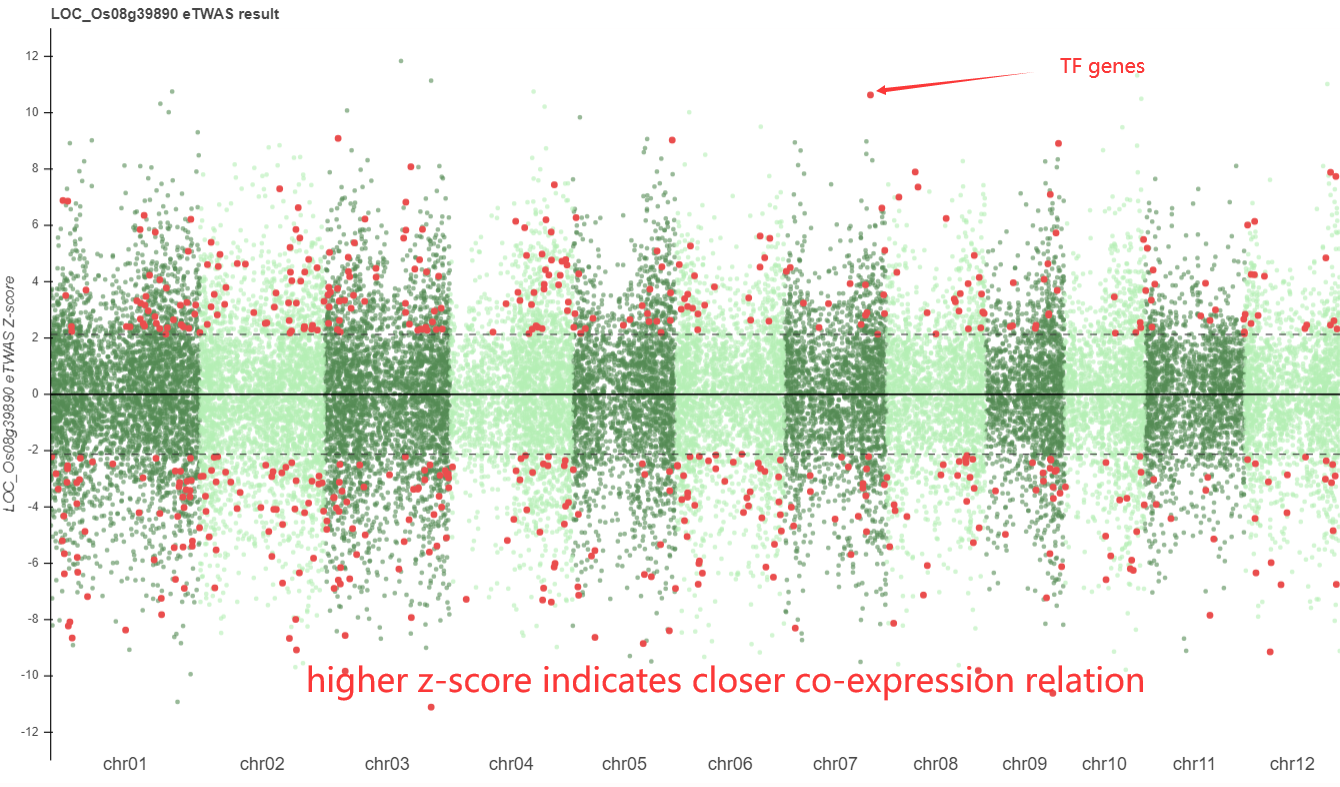
Specially there are eTWAS results demonstrated, showing a whole genomic co-expression profile for searched gene.
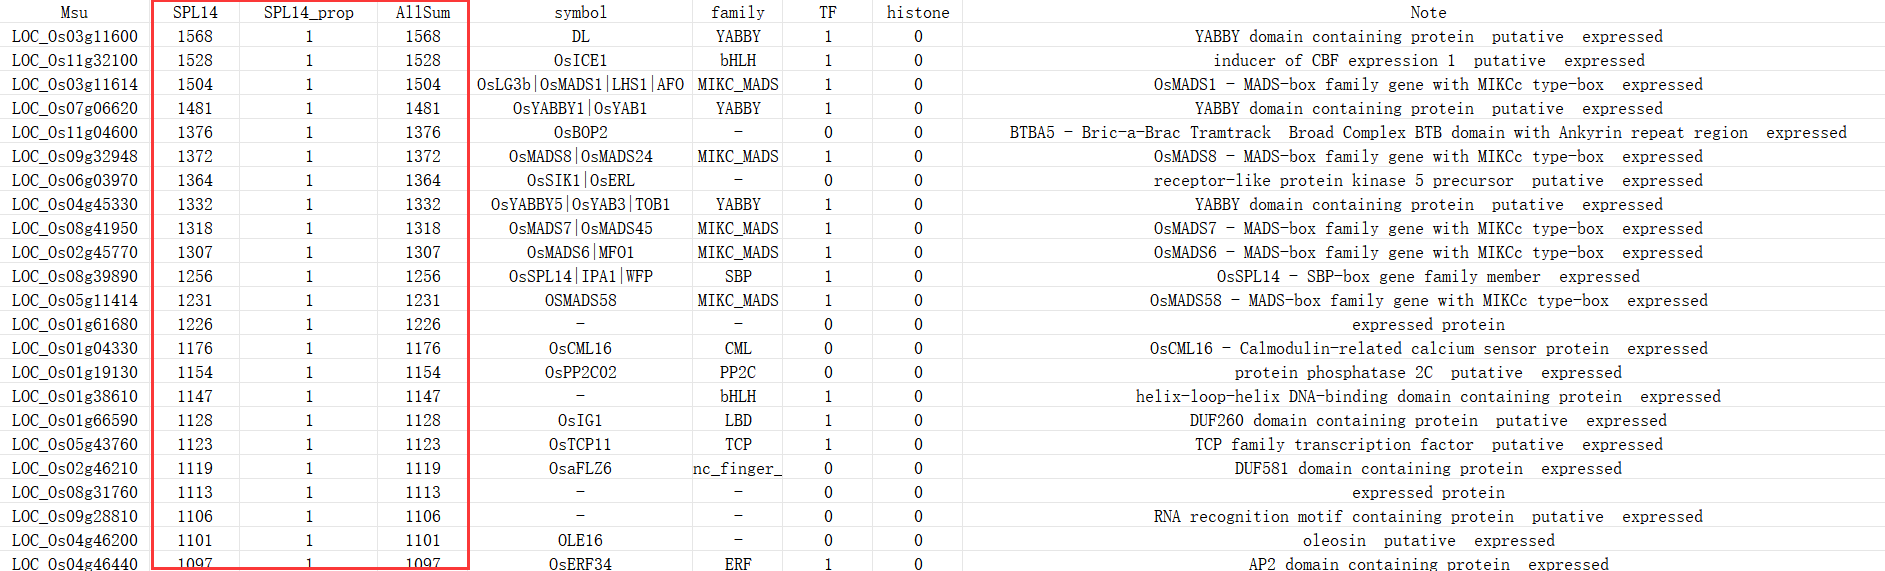
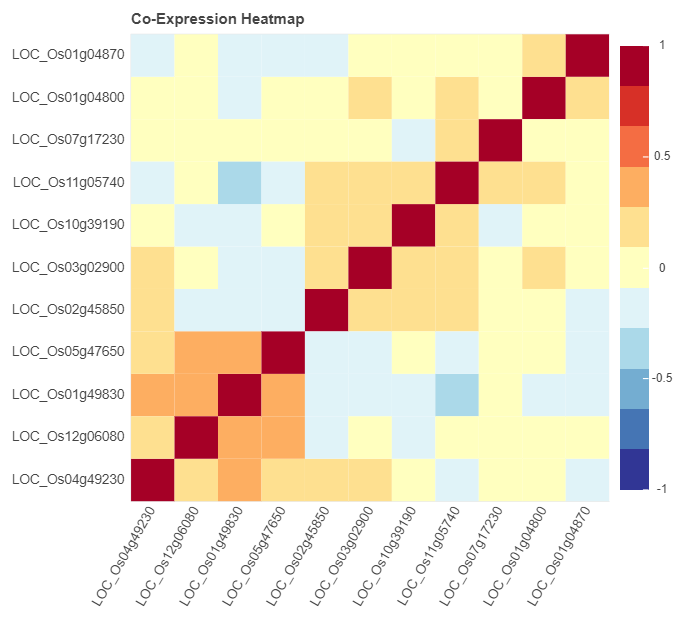
In addition, co-expression heatmap and multi-gene expression map for genes are also available in this link this link. Paste gene to the search box and check corresponding options. Then the results will be returned.
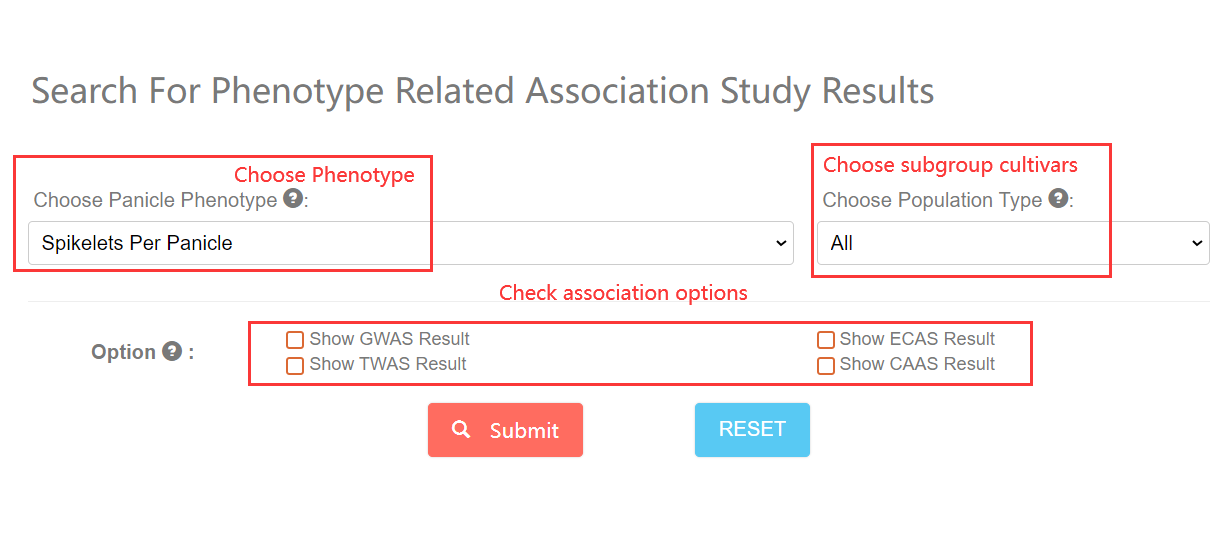
8. How to search for Phenotype related information? Top
To start with, You can click this link. Just Choose the panicle related phenotype and subgroup, and then check option boxs you needed. The phenotype related associations information will be returned.
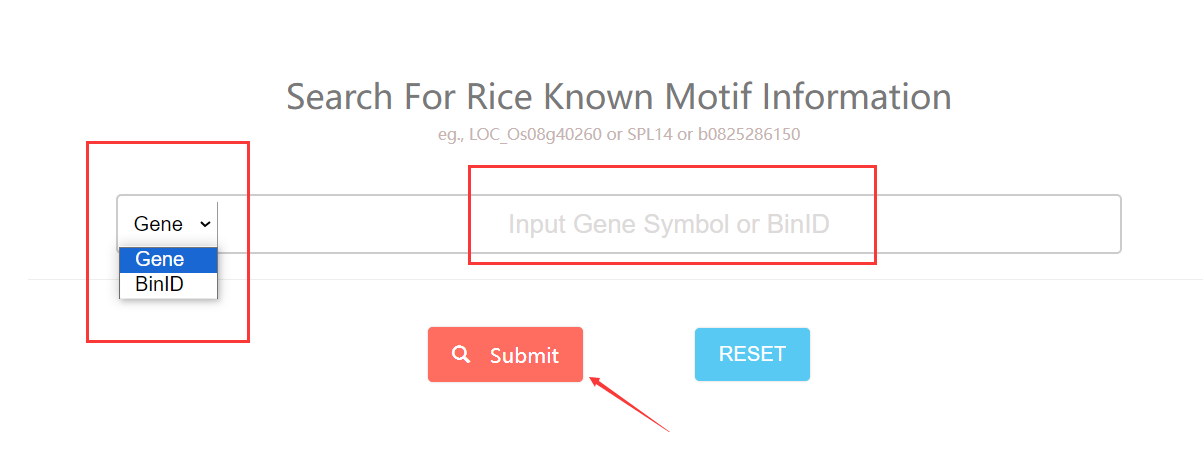
9. How to search for motif information by gene/bin? Top
To start with, You can click this link. Input the gene or bin ID you want to search and choose the search type. Then the known TF motif information of gene or inside the bin will be returned.
Detail informations about all plots are illuminated in each captions.